Sending Home Assistant logs to Graylog
I recently installed Graylog and configured Home Assistant logs to be send to Graylog. Since I’m quite happy with this setup and couldn’t find much about how to set it up I decided to write something down myself.
I’ll start this post with the basic installation to get HA logs in Graylog, at which point they can already easily be searched. After that I’ll go through a number of optional items to further tune the installation however to make searching and the integration even better.
The following image already gives an idea of the end result:
What is Graylog and why I installed it
Graylog is a log management system using Elastic Search. It can collect logs from all kinds of sources and makes them easy searchable. In my case I was a bit bugged by the fact that I kept searching for the different logs of components in Home Assistant and then searching in those logs for the messages of interest. With Graylog I have all logs at a single place and I can easily and quickly search and filter the log. And correlate logs from different sources, for example to see the zigbee2mqtt event preceding my node-red debug message. And its all amazingly fast, even for queries way back in time or with a lot of results.
By sending the logs directly from the Docker daemon trough GELF (Graylog Extended Log Format) we can benefit form extra metadata fields, In particular the container name is very useful for filtering HA logs.
Reasons not to use Graylog for HA logs
Graylog requires quite some resources. In my case installed it in a Proxmox LXC container and I had to assign it 3GB of memory to let it run without issues. If you host your HA on a Raspberry Pi then adding Graylog to it may be a bit too much (and Elastic Search on a SD-card is probably also not a good idea).
Prerequisites
- A place to host Graylog
- A Docker based HA installation
- Write access to the Docker configuration in HA (preferably using ssh or something, not from a HA terminal add on) or willing to install a 3rd party add-on.
Installing Graylog
Graylog can be installed in various ways on various platforms and the installation is well documented. So please refer to the Graylog documentation and install Graylog the way you choose.
It could be possible to follow the Docker installation installing it side-by-side to HA. But I didn’t test this and I’m not sure if the supervisor would like it for example, maybe your HA would become even more unsupported.
In my case I created a Proxmox LXC container with Debian and installed Graylog following the instructions for Debian.
[Update jan 2025] because many people seem to arrive here searching for a way to install Graylog on a Proxmox LXC container I did a new installation to provide a bit more details here. I basically followed the Debian Installation Documentation which documents the installation of Graylog 6.1 with support up to Debian 12 at the moment of writing.
I used the following steps:
- Download the Debian 12 template
- In the Server View tree on the left, expand the node for your server and select
local (<your node>).- Choose
CT Templatesand click theTemplatesbutton- Select
debian-12-standard(latest stable at the moment of writing) and clickDownload- Create the container
- Click the
Create CTbutton on the top-right- Fill
Generalwith the appropriate values- On the
Templatetab, choose the template you just downloaded- On the
Diskstab choose at least 16GB of disk space (TODO reference to Graylog tuning steps)- On the
Memorytab I choose 4GB of memory and512MBof swap (Graylog 6 really seems to require this)- Start the container, make sure to
apt updateapt-update, and optionally setup another user, install Unattended Upgrades if you like etc.- Install Graylog According the documentation
Enable the GELF UDP input adapter
- In your Graylog UI navigate to
System ➔ Inputs. - Select
GELF UDP, click Launch, - Enter
GELF UDP(or whatever you like) in the Title. - The other defaults should be fine, just check them and press
Save
Configure Docker to send its logs through GELF
Option 1 - by configuring the Docker log driver
Docker can send all logging directly to Graylog by using the gelf log driver. Home Assistant however doesn’t support changing the Docker log driver so you’r HA will become unsupported. On Home Assistant Operating System it’s probably not even possible. So only choose this option if you understand what you are doing and are willing to take the consequences.
SSH into your HA host to change the file /etc/docker/daemon.json. It can’t hurt to make a backup of the existing one.
Make sure you are able to recover in case Docker fails to start. So don’t rely on a terminal add-on from within HA itself
So do something like sudo nano /etc/docker/daemon.json, change the log-driver and add the log-opts
    "log-driver": "gelf",
    "log-opts": {
        "gelf-address": "udp://<graylog-host>:12201"
    },
    ...
Make sure your json is correct. Then restart the Docker engine. In my case this could be done with sudo systemctl restart docker.service but this might be different on your installation. If you don’t know how to restart the Docker engine you can also simply reboot the machine.
Log options may also be configured in the service init file using command line options to the daemon process. If they are already they might even override the changes in daemon.json.
Option 2 - by using the Logspout add-on
After writing the first version of this post, which only contained the above option, I have searched for other solutions to send the Home Assistant logs to Graylog. I found Logspout, which uses the Docker API from within a container to collect and forward the container logs. It can even be configured with filters and some other options. I didn’t find an add-on for Home Assistant so I created one myself. The add-on does require protection mode to be turned off unfortunately in order to get access to the Docker API.
To install the add-on, add the hassio-addons repository and install the logspout add-on following the documentation.
Find your logs in Graylog
Go to your Graylog UI, choose ‘Search’ and observe your HA logging.
You may stop at this point, but if you want to tune your installation a bit more please continue. At the end I’ll also give some tips on how to use Graylog to quickly find, filter and correlate your logging.
Optional: Create a ‘normal’ user
You may want to create a ‘normal’ user besides the default admin user. I noticed that for the admin user you can’t change things like the timezone through the UI. That’s why I created a user anyway. You can still assign the Admin role to it if you like.
Optional: Create a saved search
We can create a saved search to avoid repeating some actions. You can make a bookmark to the permalink. We will also use this later to open the saved search in an iframe in Home Assistant.
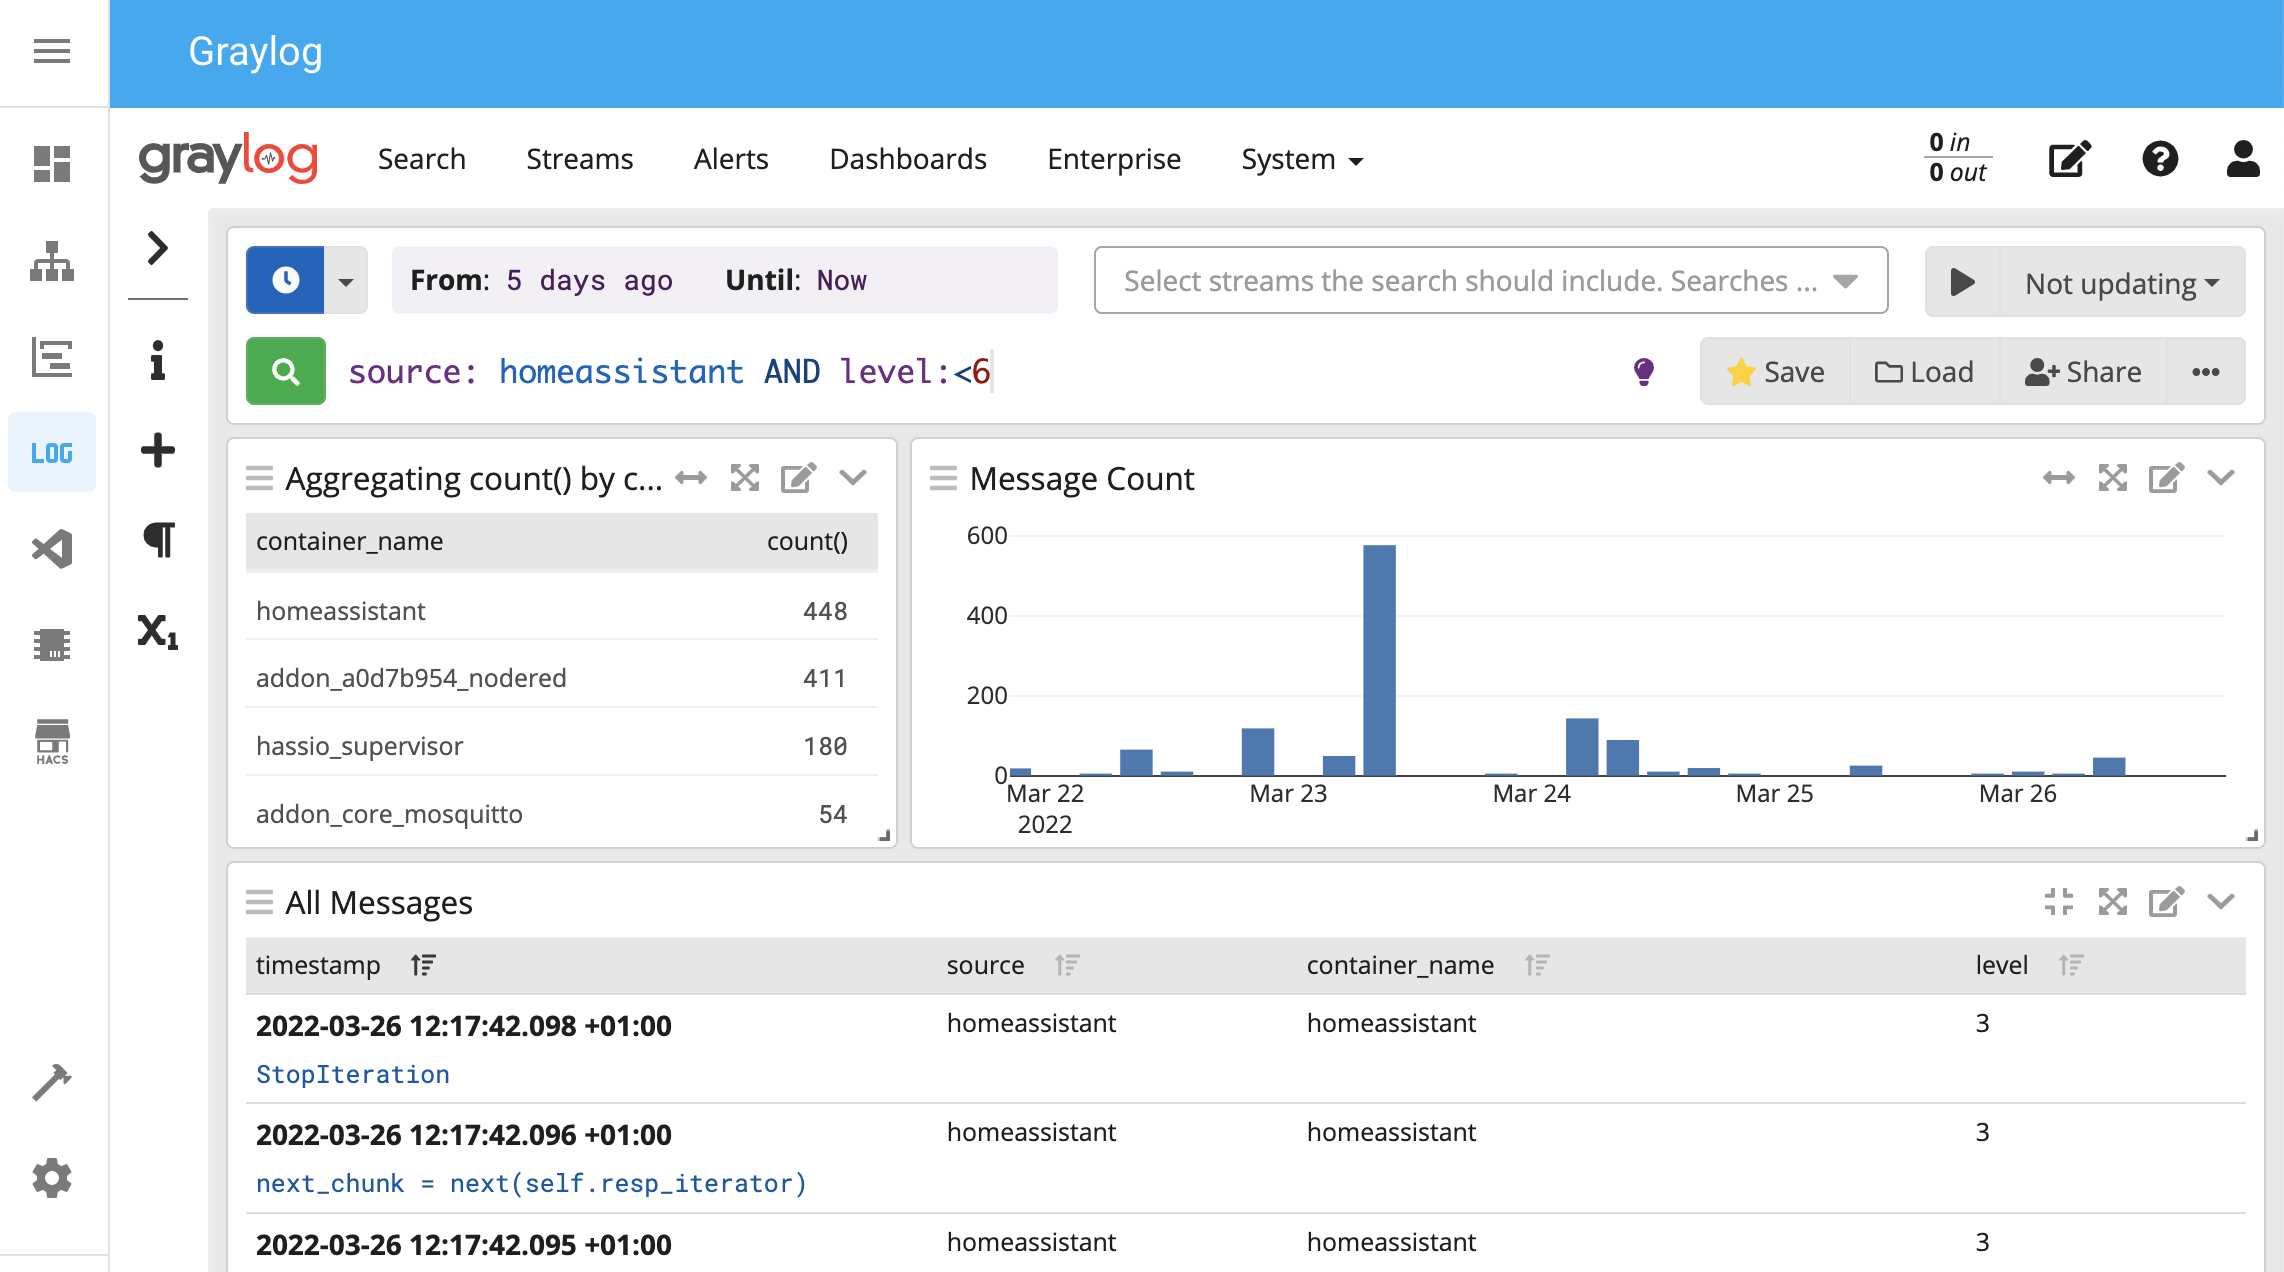
This is how I created mine (see the screenshot earlier in this post to get an idea):
- enter
source: <your HA hostname as it appears in the 'source' field>in the search box. I.e.source: homeassistant. If you don’t plan to stream other logs to Graylog you can omit this of course - Choose ᵡ₁ on the sidebar on the left, click
container_nameand selectAdd to all tables - Choose ᵡ₁ on the sidebar on the left, click
container_nameand selectShow top values - Reduce the width of the ‘Message Count’ histogram and put it next to the Aggregation widget
- Reduce the height of the Aggregation widget to match the hight of the histogram
- Optionally change the Search Time Range in the top left
- Click
Saveon the right of the search bar and name itHAor whatever you like
If you load the search you’ll notice an alphanumeric id in your URL bar (i.e. search/622def6f149e2c6fd26c5601). This can be used to permalink the search. You can change your search later on and save it again under the same name, this will not change the id of the search.
Optional: Put Graylog behind a reverse proxy
You may want to put Graylog behind a reverse proxy, for example for HTTPS (SSL) access. Again this is very well documented, so follow the Graylog Documentation to set this up.
You can make a virtual host for Graylog but the documentation also shows a setup with a path prefix. So if you already have a SSL setup for your HA and don’t want to create another virtual host you can add it with a location prefix under your existing host. I.e. if you have https://home.mysite.org than you may be able to put Graylog under https://home.mysite.org/graylog with something like this (when using nginx):
  set $graylog http://<internal_graylog_hostname_or_ip>:9000;
  location /graylog/
  {
    proxy_set_header Host $http_host;
    proxy_set_header X-Forwarded-Host $host;
    proxy_set_header X-Forwarded-Server $host;
    proxy_set_header X-Forwarded-For $proxy_add_x_forwarded_for;
    proxy_set_header X-Graylog-Server-URL https://$server_name/graylog/;
    rewrite          ^/graylog/(.*)$  /$1  break;
    proxy_pass       $graylog;
  }
Optional: Put Graylog in the HA sidebar
Graylog can be put in the sidebar of HA, opening the UI in an iframe. This does reduce the available size a bit of course, but with a minimized HA sidebar it works pretty wel. Links that open another tab, like ‘Show surrounding messages’ will escape the iframe but for me that’s hardly an issue.
In your HA’s configuration.yaml put the following configuration:
panel_iframe:
  graylog:
    title: "Graylog"
    url: "<external_url_to_graylog>/search/<your_ha_search_id>"
    icon: mdi:math-log
If you added location /graylog to your HA virtual host earlier you should use something else than graylog: here (for example just use log:) because HA will use this name as path resulting in unexpected behavior on page reload.
And yes I know math-log doesn’t have to do anything with logging ![]() .
.
Optional: Extract log levels
Graylog uses syslog log levels by default, a range from 0 to 7 with 3 being an error and 6 an info message. Since Docker intercepts the logs from stdout and stderr of the containers it doesn’t know anything about the actual log level and simply uses 3 for stderr and 6 for stdout. The logging of HA and add-ons isn’t really standardized and most containers simply seem to send all logging either to stdout or stderr rendering the use of these log levels quite useless.
Most messages do contain words like error or debug however, so I used a Graylog pipeline to extract the level based on that. The container hassio_audio logs messages with prefixes like I: and E: so I included those too.
To do this also, select System ➔ Pipelines. Select Manage rules. Create a rule with Description fatal and Rule source:
rule "fatal"
when
   has_field("container_name")
   AND to_bool(regex("(^F:)|(?i)fatal", to_string($message.message)).matches)
then
   set_field("level", 1);
end
Create five other rules replacing the description, rule name, regex and level with values from the table below:
| Rule | Regex | Level |
|---|---|---|
| fatal | (^F:)|(?i)fatal |
1 |
| critical | (^C:)|(?i)critical |
2 |
| error | (^E:)|(?i)error |
3 |
| warning | (^W:)|(?i)warn |
4 |
| info | (^I:)|(?i)info |
6 |
| debug | (^D:)|(?i)debug |
7 |
I skipped ‘notice’ (5) because I’m not sure if it will actually occur as such in the logs.
Then choose Manage pipelines and create a pipeline with title Sanitize log levels and put all of the just created rules in stage 0.
Now you can search (for new messages) with something like level:<6 to select all messages more important than just informational.
Optional: Remove Ansi escape sequences
One of the add-ons added ANSI escape sequences (color codes) to the log output. I removed those using an extractor on the GELF UDP input. I could probably have done this also by using pipelines but I tackled this problem just before I discovered them.
If you use the logspout add-on this might not be necessary. Some resources on the internet seem to suggest that logspout already handles ANSII escape sequences, but I didn’t verify this yet.
To do the same, find a message with ansi color codes (or any other message), expand it and click on the message value (not the field name itself). In the dropdown you can select Create extractor. As selector type choose Regular expression and then Submit. Enter the following:
| Regular expression | \[\d+m |
| Replacement | <leave empty> |
| Extractor title | Remove ANSI Color codes |
You can manage your extractors by navigating to System ➔ Inputs and selecting Manage extractors next to your input.
Optional: Send syslog to graylog
Graylog can of course collect logs from other sources also. I configured for example my Unifi AP’s to also log to Graylog, just because it’s possible. I must admit that they produce quite some logging including many warnings that don’t tell me anything so I wonder if I wasn’t happier when I didn’t know about them. But on the other side, I can choose to ignore those and in the unlikely event that I might need them I do at least have easy access. And I can always route them into a specific stream if the bother me too much.
When using logspout and the standard yournald Docker log driver this will end up in duplicate log messages.
To enable Syslog input in Graylog:
- Go to
System ➔ Inputs - Choose
Syslog UDPand clickLaunch - Give it the title
Syslog UDPor whatever you like - The other defaults should be fine, just check them and press
Save
An obvious source of syslog events is of course the host running HA. On my Debian system I simply created the file
/etc/rsyslog.d/80-gelf.conf
*.* @<your internal graylog host or ip>:1514;RSYSLOG_SyslogProtocol23Format
and restarted the rsyslog service with
sudo systemctl restart rsyslog.service
If your host doesn’t use syslog you may need to search a bit across the internet.
Some Graylog tips and tricks
If you are new to Graylog these tips might be useful (you may have picked up some of them already along this post). These are only basic, I won’t go into more advanced stuff.
- Noticed the 💡 on the right of the search bar? It gives quick access to a lot of help
- If you click on a field name (like container_name) anywhere you can add it to the table or show the top values
- If you click on a field value (like
addon_a0d7b954_nodered) anywhere you can add it to the query (filter on messages with the same value) or exclude it from the results (effectively filtering the messages out). Because this also works inside the top-values Aggregate view I like to use the ‘container_name’ aggregation to quickly select the container for which I like to see the logs - If you expand a message you can choose ‘Show surrounding messages’. This is very useful if you filtered the logging to isolate an error message for example and want to know about other (non-error) messages around it, i.e. to find out that a message from node-red is related to the restart of the core container.
- If you drag a selection over the histogram the time range will be narrowed accordingly
Conclusion
Graylog makes searching through logs much more fun. It does require quite some resources though (3G of memory). Unfortunately HA does not officially support adjusting the Docker log configuration, making it more tricky than necessary to configure the Docker log driver. Luckily there is an alternative by using logspout in an add-on.
To get most out of the logs (levels in particular) some additional tweaking was necessary but in the end it works like a charm!